Electrify Chicago
An independent tool for viewing City of Chicago building data
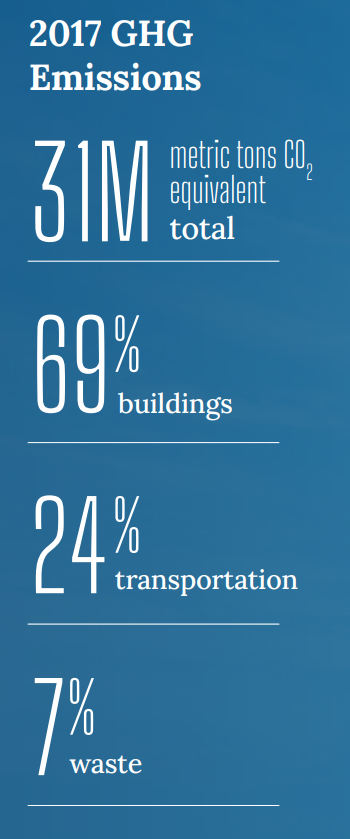
According to the
2022 Chicago Climate Action Plan ,
69% of Chicago's emissions come from buildings, making
building emissions our biggest challenge and our biggest opportunity as a city
to tackle climate change. At Electrify Chicago, we showcase building performance using
publicly available data supplemented by community-submitted photographs and building
owners.
,
69% of Chicago's emissions come from buildings, making
building emissions our biggest challenge and our biggest opportunity as a city
to tackle climate change. At Electrify Chicago, we showcase building performance using
publicly available data supplemented by community-submitted photographs and building
owners.
Start by looking at Chicago's buildings with the highest greenhouse gas intensity i.e. emissions per square foot. Large, efficient, buildings can perform much better than very inefficient small buildings on this metric.
New Article
📰 $30 Million In Missed Fines
The City Of Chicago failed to collect $30 million in potential fines from the building benchmarking ordinance, reducing transparency and accountability.
Legislative update! 🎉
As of late January 2024, legislation is being introduced to require new use more efficient forms of water and space heating, via the Clean And Affordable Buildings Ordinance (CABO), which will reduce the number of highly polluting and inefficient buildings that end up on this site.
If you're in Chicago,
write to your alderman to support the CABO!
Chicago Buildings by Greenhouse Gas Intensity
Note: Data includes large Chicago buildings with data from 2022, unless explicitly stated otherwise.
Note: This data only includes buildings whose emissions are reported
under the
Chicago Energy Benchmarking Ordinance. According to the City “As of 2016,
this list includes all commercial, institutional, and residential buildings larger than
50,000 square feet.” This dataset is also then filtered to only buildings with
reported emissions > 1,000 metric tons CO2 equivalent.
The latest year of data is from 2022, but we update the site regularly when new data is available, and some buildings may have failed to report that year, and only have older data available.
| Property Name / address | Primary Property Type |
Greenhouse Gas Intensity (kg CO2 eq./sqft) |
Total Greenhouse Emissions (metric tons CO2 eq.) |
|---|---|---|---|
|
John T. Rettaliata Engineering Center
🕰️
(Illinois Tech)
10 W 32nd Street
| College/University | 31.4 kg/sqft | 4,204 tons |
|
4700 N MARINE DR
🕰️
4700 N MARINE DR
| Medical Office | 31.1 kg/sqft | 4,594 tons |
|
53100512--CHICAGO
🕰️
1615 S Clark St
| Supermarket/Grocery Store | 30.7 kg/sqft | 1,899 tons |
|
Jewel Osco, 03470-Elston & Addison
🚩
3570 N Elston Ave
| Supermarket/Grocery Store | 30.6 kg/sqft #16 Highest
| 1,683 tons
Highest 28%
|
|
Pete's Madison
🚩
2333 W Madison
| Supermarket/Grocery Store | 30.4 kg/sqft #17 Highest
| 2,007 tons
Highest 23%
|
|
CCD
🕰️
5700 S Maryland Ave
| Hospital (General Medical & Surgical) | 30.2 kg/sqft | 36,452 tons |
|
6009 N BROADWAY
🚩
6009 N BROADWAY
| Supermarket/Grocery Store | 29.9 kg/sqft #18 Highest
| 1,670 tons
Highest 28%
|
|
Pete's 118th
🚩
3454 - 3620 E 118th St
| Supermarket/Grocery Store | 29.6 kg/sqft #19 Highest
| 1,598 tons
Highest 29%
|
|
Pete's Cermak
🚩
2526 W Cermak Ave
| Supermarket/Grocery Store | 29.5 kg/sqft #20 Highest
| 2,186 tons
Highest 21%
|
|
53100507--CHICAGO
🕰️
5353 N Elston Ave
| Supermarket/Grocery Store | 29.1 kg/sqft | 1,836 tons |
|
Wrigley Global Innovation Center
🕰️
1132 W BLACKHAWK ST
| Office | 29.0 kg/sqft | 5,557 tons |
|
Elston Plaza
🕰️
5033 N. ELSTON AVE
| Retail Store | 28.8 kg/sqft | 2,503 tons |
|
DCAM
🕰️
5758 S Maryland Ave
| Ambulatory Surgical Center | 28.6 kg/sqft | 15,393 tons |
|
70800552 -- Chicago
🕰️
7030 S Ashland Ave
| Supermarket/Grocery Store | 28.5 kg/sqft | 1,804 tons |
|
Jewel Osco, 03187-119th and Marshfield
🚩
11730 S Marshfield Ave
| Supermarket/Grocery Store | 28.2 kg/sqft #21 Highest
| 1,739 tons
Highest 27%
|
Data Source:
Chicago Energy Benchmarking Data