Electrify Chicago
An independent tool for viewing City of Chicago building data
According to the
2022 Chicago Climate Action Plan,
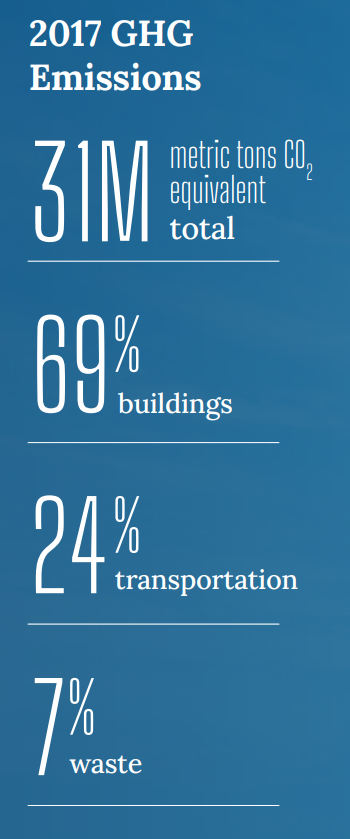
69% of Chicago's emissions come from buildings, making
building emissions our biggest challenge and our biggest opportunity as a city
to tackle climate change. At Electrify Chicago, we showcase building performance using
publicly available data supplemented by community-submitted photographs and building
owners.
Start by looking at Chicago's buildings with the highest greenhouse gas intensity i.e. emissions per square foot. Large, efficient, buildings can perform much better than very inefficient small buildings on this metric.
New Article
📰 $30 Million In Missed Fines
The City Of Chicago failed to collect $30 million in potential fines from the building benchmarking ordinance, reducing transparency and accountability.
Legislative update! 🎉
As of late January 2024, legislation is being introduced to require new use more efficient forms of water and space heating, via the Clean And Affordable Buildings Ordinance (CABO), which will reduce the number of highly polluting and inefficient buildings that end up on this site.
If you're in Chicago,
write to your alderman to support the CABO!
Chicago Buildings by Greenhouse Gas Intensity
Note: Data includes large Chicago buildings with data from 2022, unless explicitly stated otherwise.
Note: This data only includes buildings whose emissions are reported
under the
Chicago Energy Benchmarking Ordinance. According to the City “As of 2016,
this list includes all commercial, institutional, and residential buildings larger than
50,000 square feet.” This dataset is also then filtered to only buildings with
reported emissions > 1,000 metric tons CO2 equivalent.
The latest year of data is from 2022, but we update the site regularly when new data is available, and some buildings may have failed to report that year, and only have older data available.
| Property Name / address | Primary Property Type |
Greenhouse Gas Intensity (kg CO2 eq./sqft) |
Total Greenhouse Emissions (metric tons CO2 eq.) |
|---|---|---|---|
|
3224 3244 N HALSTED ST
3224 3244 N HALSTED ST
| Multifamily Housing | 3.3 kg/sqft
Lowest 4%
| 900 tons
Highest 49%
|
|
Anchor House
🕰️
1230 W. 76th St
| Multifamily Housing | 3.3 kg/sqft | 477 tons |
|
1327 W WASHINGTON BLVD
1327 W WASHINGTON BLVD
| Multifamily Housing | 3.3 kg/sqft
Lowest 4%
| 332 tons
Lowest 11%
|
|
3950 W BRYN MAWR AVE
3950 W BRYN MAWR AVE
| Multifamily Housing | 3.3 kg/sqft
Lowest 4%
| 201 tons
Lowest 2%
|
|
4653 4661 S LAKE PARK AVE
🏆
4653 4661 S LAKE PARK AVE
| Multifamily Housing | 3.3 kg/sqft
Lowest 4%
| 190 tons
Lowest 2%
|
|
33 W HURON ST
33 W HURON ST
| Multifamily Housing | 3.3 kg/sqft
Lowest 4%
| 607 tons
Lowest 34%
|
|
King College Prep -CPS
📷
🕰️
(CPS)
4445 S Drexel Blvd
| K-12 School | 3.3 kg/sqft | 1,031 tons |
|
2731 2739 N MILWAUKEE AVE
2731 2739 N MILWAUKEE AVE
| Multifamily Housing | 3.2 kg/sqft
Lowest 4%
| 224 tons
Lowest 3%
|
|
4124-4132 N Kedvale Avenue
🏆
4124-4132 N Kedvale Avenue
| Multifamily Housing | 3.2 kg/sqft
Lowest 4%
| 166 tons
#30 Lowest in Chicago*
|
|
Wildwood IB World Magnet School
🕰️
6950 N Hiawatha Avenue
| K-12 School | 3.2 kg/sqft | 189 tons |
|
Wolf Point East
313 W Wolf Point Plaza
| Multifamily Housing | 3.2 kg/sqft
Lowest 4%
| 2,983 tons
Highest 14%
|
|
Oakwood Shores 2D
3744-54 S ELLIS AVE
| Multifamily Housing | 3.2 kg/sqft
Lowest 4%
| 638 tons
Lowest 36%
|
|
4447 N Kedzie Ave
4447 N Kedzie Ave
| Multifamily Housing | 3.2 kg/sqft
Lowest 4%
| 236 tons
Lowest 4%
|
|
Schreiber Center- ID#254355
🕰️
(Loyola)
16 E PEARSON ST
| College/University | 3.2 kg/sqft | 409 tons |
|
Metro North Condominium Association
3946 N Ravenswood Ave
| Multifamily Housing | 3.2 kg/sqft
Lowest 4%
| 246 tons
Lowest 4%
|
Data Source:
Chicago Energy Benchmarking Data
